

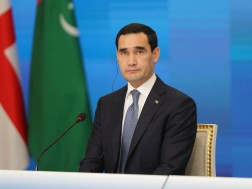
As Turkmen President Serdar Berdimuhamedow, who is on his first state visit to Georgia, stated at a joint briefing with Prime Minister Irakli Kobakhidze, the bilateral logistics portfolio includes very promising projects. According to him, in addition to the transport sector, the parties want to deepen partnership in the energy, telecommunications, textile and construction sectors.Berdimuhamedow emphasized the historical ties between the two countries and noted that the agreements signed during the current state visit also envisage the expansion of scientific and educational cooperation between universities.It is noteworthy that the high-level visit to Tbilisi coincides with the 35th anniversary of the establishment of diplomatic relations between Georgia and Turkmenistan.
1784287762

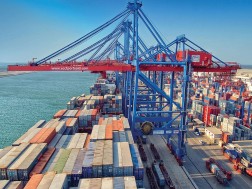
According to Moldovan publication point.md, the project has reached this phase following the signing of a memorandum of understanding between Transelectrica and the Georgian State Electrosystem (GSE).The high-voltage submarine cable, which will run along the bottom of the Black Sea, will provide electricity transmission between the two countries, effectively opening a new route for electricity supply to the European Union.“One of the most important energy projects in the region is taking shape. Following the signing of the Memorandum of Understanding, the partnership is entering the stage of technical preparation, which is necessary to create the infrastructure for the energy connection between Romania and Georgia,” Transelectrica said in a statement.What does the project mean for Romania and what are its parameters?For Romania, the implementation of this project means closer integration into the European energy system, access to new sources of electricity, increased energy security, the ability to integrate more renewable energy, and a strengthening of the country’s role in Europe’s energy infrastructure.The project involves the construction of a high-voltage transmission line and a digital connection between the Georgian city of Anaklia and the Romanian city of Constanta. Total length: 1,155 kilometers (of which 1,115 km will run on the Black Sea bed and 40 km on land). Capacity: The planned capacity of the line is 1,300 MW. Transelectrica notes that the project is a significant step towards the development of modern energy infrastructure and strengthening international cooperation.
1784205715

This is an important innovation, because last year only one price was set for Saperavi and other grape varieties. In accordance with the Law “On Vine and Wine”, in the case of grapes of permitted varieties, price differentiation will be carried out by the percentage of sugar content.What will the subsidy for the 2026 harvest cost the budget?The government has so far issued only one decree for the 2026 harvest, according to which GEL 60 million should be spent on subsidies. However, the experience of past years shows that the actual expenditure, as a rule, is much higher than the original plan.For comparison, the government had initially also set GEL 60 million for subsidizing the 2025 harvest, although in the end the actual expenditure turned out to be 3.5 times higher – GEL 220 million (in total, GEL 241 million was spent from the budget to purchase grapes that remained outside the private sector).It should be recalled that within the framework of the 2025 harvest, due to a surplus harvest and low demand from the private sector, the state had to purchase 145,742,918 kilograms of grapes from the budget.
1784115567

China Eastern Airlines will implement the flights three times a week on Wednesdays, Fridays and Sundays.China Eastern Airlines is the third Chinese airline to operate regular flights between Georgia and China.“The new route will help strengthen tourism, business, and trade-economic ties. Combined with the visa-free regime, travel between the two countries will become easier,” the Union of Georgian Airports said.Tickets can be purchased on the airline's official website: www.ceair.com
1784032589

According to the American Association of Wine Economics (AAWE), the value of wine imported from Georgia to Canada in 2025 increased from $1.23 million to $1.58 million (+$0.35 million) compared to 2024.The changes in the market are related to the blockade imposed by Canada on American products. In 2024-2025, wine imports from the US fell from $431.02 million to $99.94 million, a dramatic 76.8% decrease (-$331.08 million).The European giants benefited the most from the substitution of American products: France: Imports increased by 12.7% to $601.13 million (+$67.90 million). Italy: The increase was 6.6% and the volume increased to $509.83 million (+$31.48 million). Spain: Imports increased by 10.2% ($148.18 million). Significant increases were recorded by Australia (+18.4%), New Zealand (+16.6%) and Chile (+24.1%).Despite increased exports from individual countries, including Georgia, the US wine deficit could not be fully filled. Total global imports of Canadian wine fell by 7% to $1.93 billion, meaning that almost half of the US deficit was simply not replaced in the market.
1783946053
Of this figure, GeoStat reports that exports accounted for USD 3,876.7 million, reflecting a 20.1 per cent surge, while imports stood at USD 9,048.8 million, representing a modest growth of 0.7 per cent.Consequently, the negative trade balance for January–June 2026 reached USD 5,172.1 million, constituting 40.0 per cent of the total foreign trade turnover.
1783945848

According to the ministry, an order has already been issued, which determines the exact rules and conditions for checking the noise level using a certified portable device.According to the resolution of the Government of Georgia, in populated areas at night - from 23:00 to 08:00, the noise generated during the operation of vehicles should not exceed 80 decibels.The Code of Administrative Offenses of Georgia provides for strict sanctions for violation of the established norms: First case: results in a fine of 100 GEL and a deduction of 10 points on the driver's license; Second case: Repeating the same action will result in a fine of 200 GEL and a reduction of 20 points; Third and each subsequent case: will result in a fine of 300 GEL and a reduction of 30 points on the driving license.
1783418513
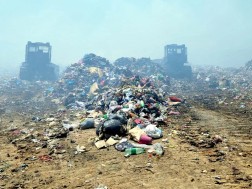
According to the government decree, the Ministry of Environmental Protection and Agriculture will oversee the planning and implementation process, while the state-owned Solid Waste Management Company of Georgia will be responsible for carrying out the projects. The company will need to prepare the necessary documentation and organize the construction of the facilities in compliance with Georgian legislation and, where applicable, international financial institutions’ procurement rules.The planned regional landfill complexes will serve four zones: Kakheti; Shida Kartli and Mtskheta-Mtianeti; Imereti, Racha-Lechkhumi and Kvemo Svaneti; and Samtskhe-Javakheti. The projects will also include waste transfer stations and are expected to incorporate waste processing facilities.The government has not yet disclosed the estimated cost of the projects. To finance international consulting services required for project preparation, the Ministry of Environmental Protection and Agriculture will hold consultations with international financial institutions.
1783418409

In detail: The residential segment index decreased by 0.5 percent compared to the previous month and increased by 0.3 percent compared to the same month of the previous year; The non-residential segment index increased by 0.3 percent compared to the previous month and by 7.0 percent compared to the same month of the previous year; The civil segment index increased by 1.5 percent compared to the previous month and by 6.8 percent compared to the same month of the previous year; In May 2026 the Construction Cost Index (CCI) increased by 0.5 percent compared to the previous month. The change was mainly due to a 0.6 percent increase in the prices for construction materials, which contributed 0.35 percentage points to the total index change.Compared to May 2025 the CCI increased by 4.1 percent. The latter was largely caused by the 17.2 percent increase in the cost category of transportation, fuel and electricity and by the 1.1 percent increase in average monthly nominal wages of employees in the construction sector, which contributed 2.06 and 1.12 percentage points to the total index change, respectively. Along with this, the Construction Cost Index posted a 28.1 percent increase compared to February 2022.
1783418281

According to the Ministry of Environmental Protection and Agriculture, a corresponding amendment was made to the Government Resolution No. 304 of June 8, 2022, “On Technical Regulations - Plastic Materials and Products (Objects) Intended for Contact with Food”.According to the adopted amendment, new deadlines have been set for the imposed restrictions. In particular, the new date for the entry into force of the ban on single-use plastic food containers was set as January 1, 2027, while the ban on single-use cups will come into force from July 1, 2027.
1783336407
Georgian companies post solid results on London Stock Exchange
1783336650
MFOs were fined
1783594547
NBG launches online platform to compare banking fees and deposit rates
1784204718
Gov't Plans to Build Four Regional Landfills Across Georgia by 2030
1783418409
Anaklia Port to be Built under Landlord Model - State to Remain Owner...
1783336098